
by Curtis - aka The Slopes Guy
Slopes started 13 years ago (!!) when I was tracking my day with a different app and I kept getting frustrated with how it visualized my data. The other app wasn't surfacing the things I cared about, instead it made me work, requiring me to cross-reference data across multiple screens to answer what I though were simple questions.
Well, here we are again, this time with weather reports for ski resorts.
This summer I set out to take a stab at how I'd want to see weather told for ski resorts, built around two core ideas: managing expectations and surfacing highlights.
The Daily Forecast
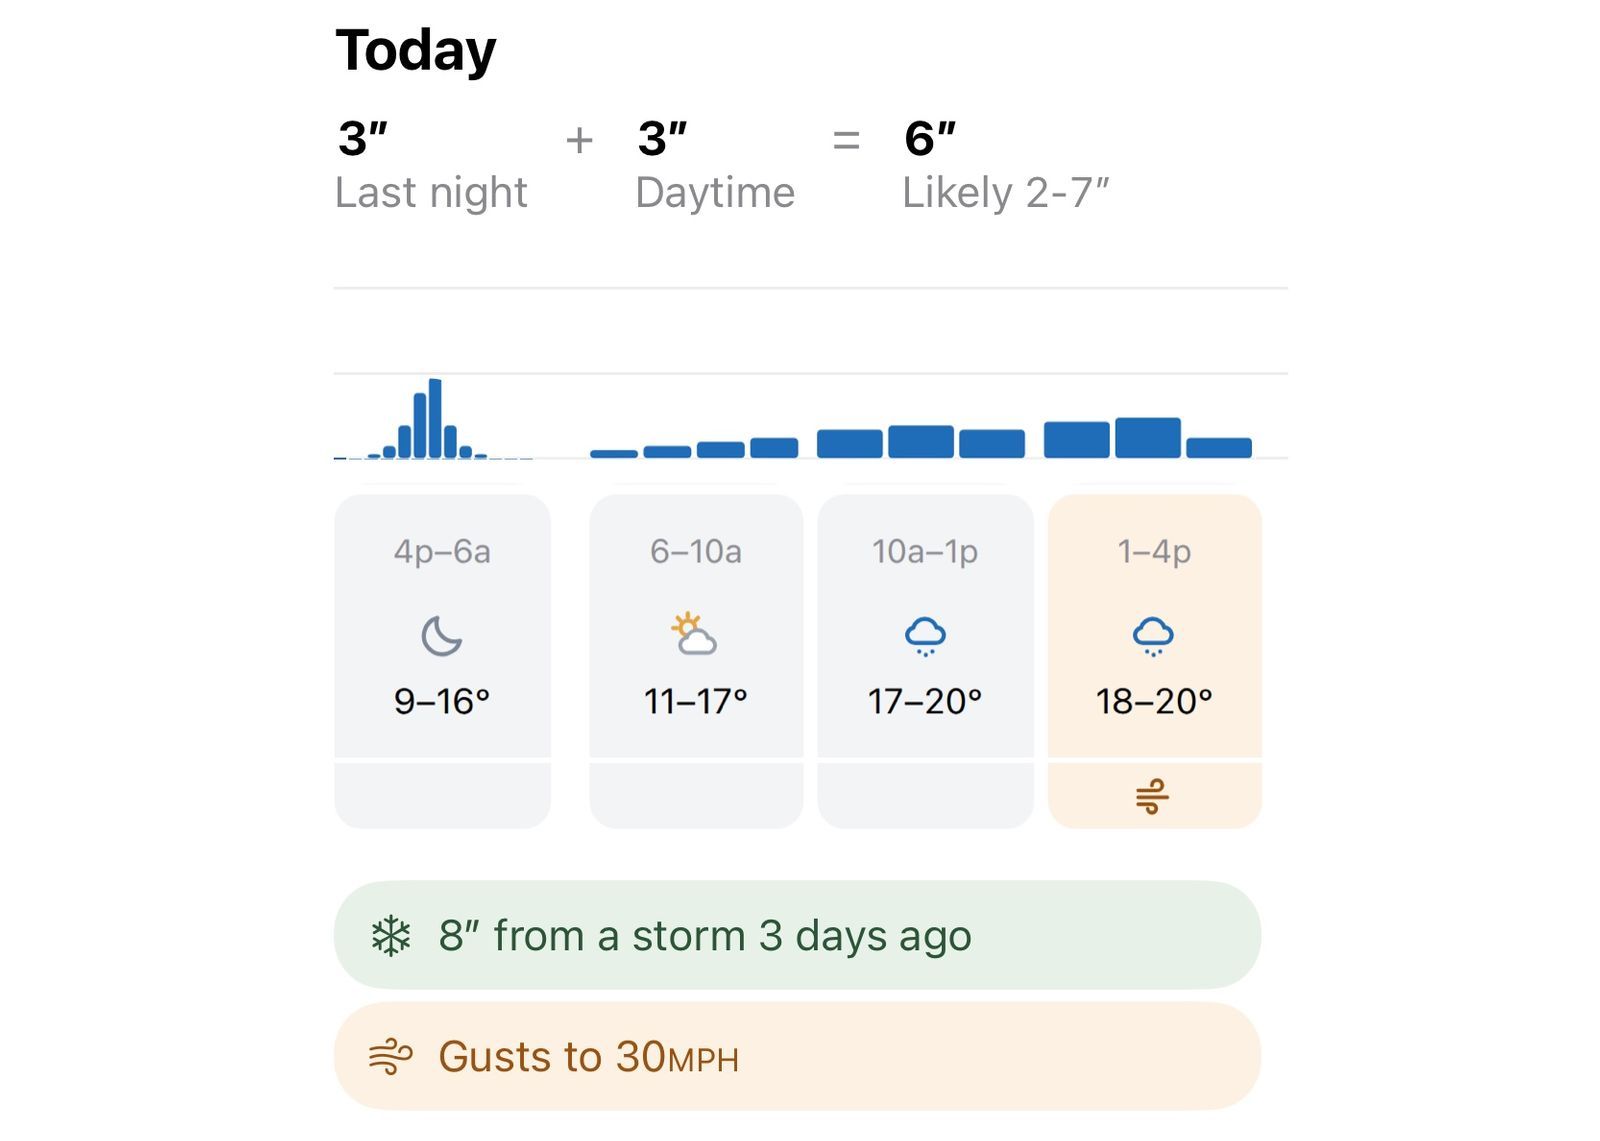
When you're looking at a resort in Slopes, the first thing you'll see a the detailed forecast for today and tomorrow. They follow the same format, and for each we break snowfall out in overnight vs while you ride.
I always hate waking up to check the 6am snow stake reports to get excited, just to end up checking the 24hr playback for the snow stake to get slightly let down. See, the 6am reports and the "last 24 hours" reporting always includes what was tracked out from the day before while people skied. So for Slopes, overnight starts at 4pm the day before (when most resorts close for the day) to help you make decisions based on fresh untracked snow.
The Details That Matter
Moving beyond snowfall, there is so much data to parse through to figure out what the ski day is going to be like. Was there a thaw and freeze cycle overnight? Was there a recent notable storm cycle? Are there likely wind holds? Did new runs open yesterday?
Slopes will intelligently show flags for relevant hourly information (like the wind gusts above in the afternoon block) and other items of note on the day. We'll call out positive and negative flags, like calling out a recent storm cycle from a few days ago.
My goal was to distill weather down to just show exactly what I'd tell a friend, the core information I need make an educated decision on if tomorrow is worth a sick day.
Looking Further Out
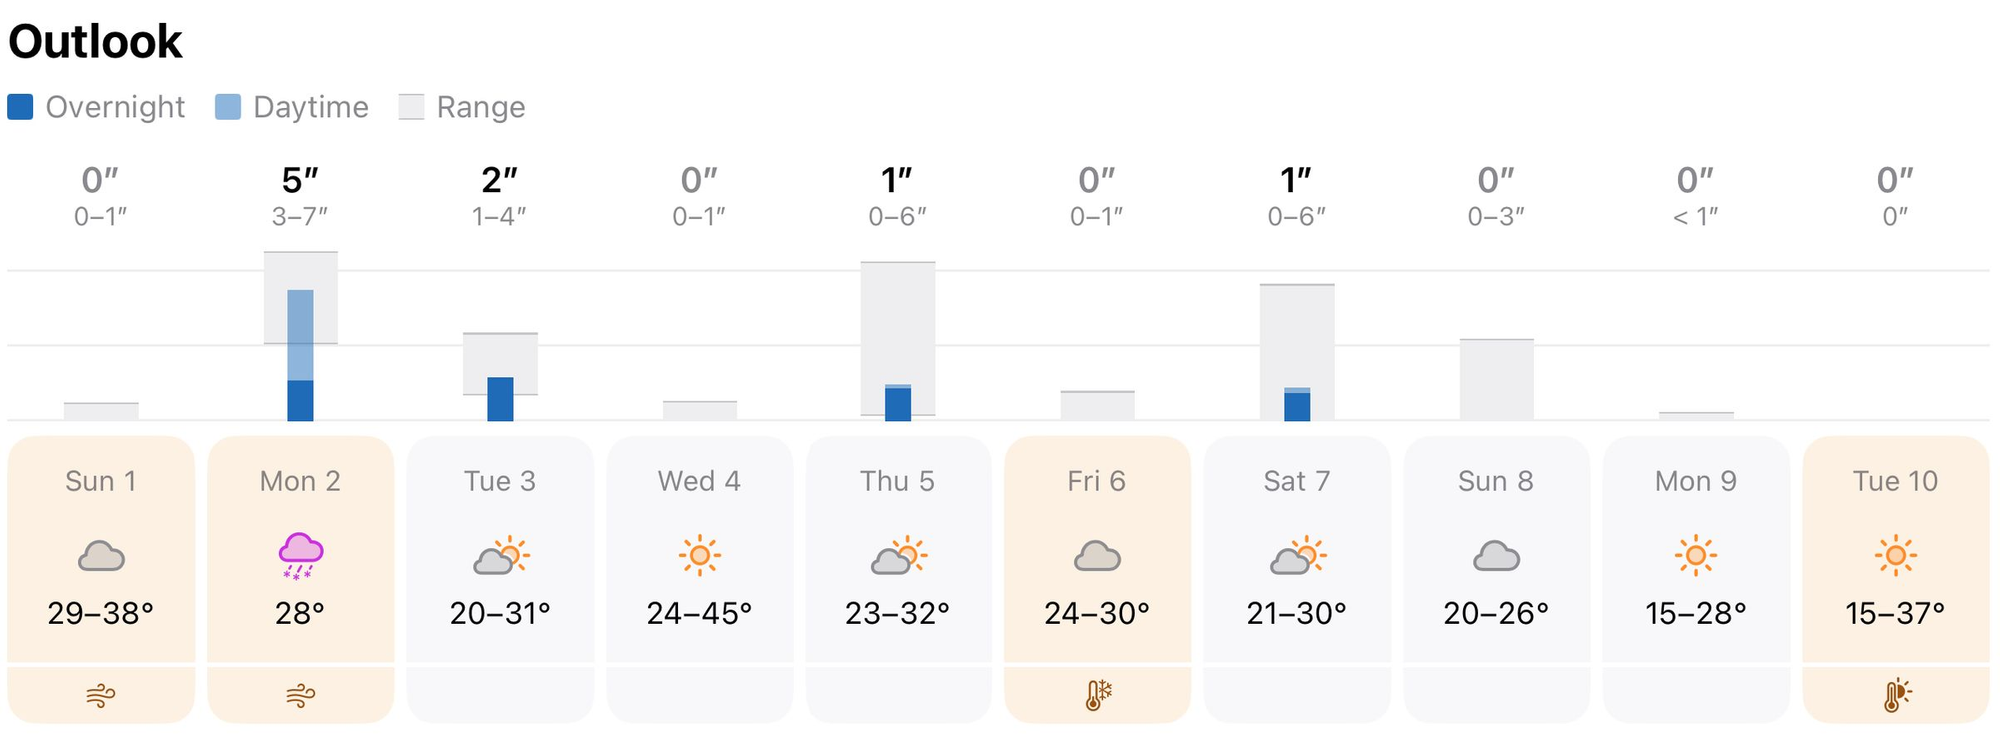
These core concepts extend to our outlook charts, which are shown as a 10-day forecast on a resort's detail screen.
The outlook continues our skier-focused mindset of reporting snowfall. Unlike all the generic weather reporting apps, our overnights count towards the next day, because that's when you'd ski and get the fresh tracks. So the 5 inches shown here for Monday means "2 inches Sunday 4pm - Monday morning, and 3 inches Monday through 4pm."
We're taking a very opinionated and skier-focused mindset in how we communicate snowfall, focused on the ski day not the calendar day.
Because we're looking further out into the future, the range of snowfall predictions are visualized here to clearly communicate how sure the models are. Forecasting is all about probability, and behind that headline-worthy "6 inches of snow Monday!" is actually "6 inches has an 60% chance, then 2 inches at 30%, and 3 inches at 10%."
Lastly, we include important flags for the day (same as from the Today chart) that we'd care about - gusts, thaws, freezes, etc.
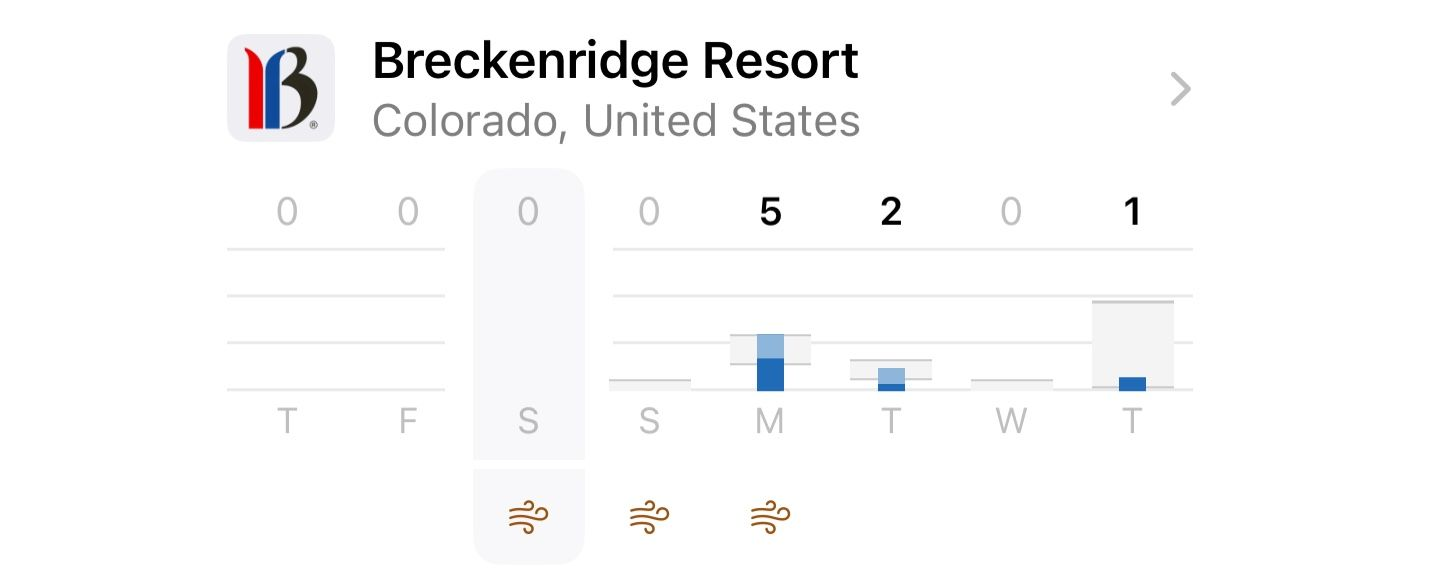
A distilled version of this outlook chart is also visible on the main Resort tab. You can follow all your favorite resorts and see the 5-day forecast + the previous 2 days.
User Conditions
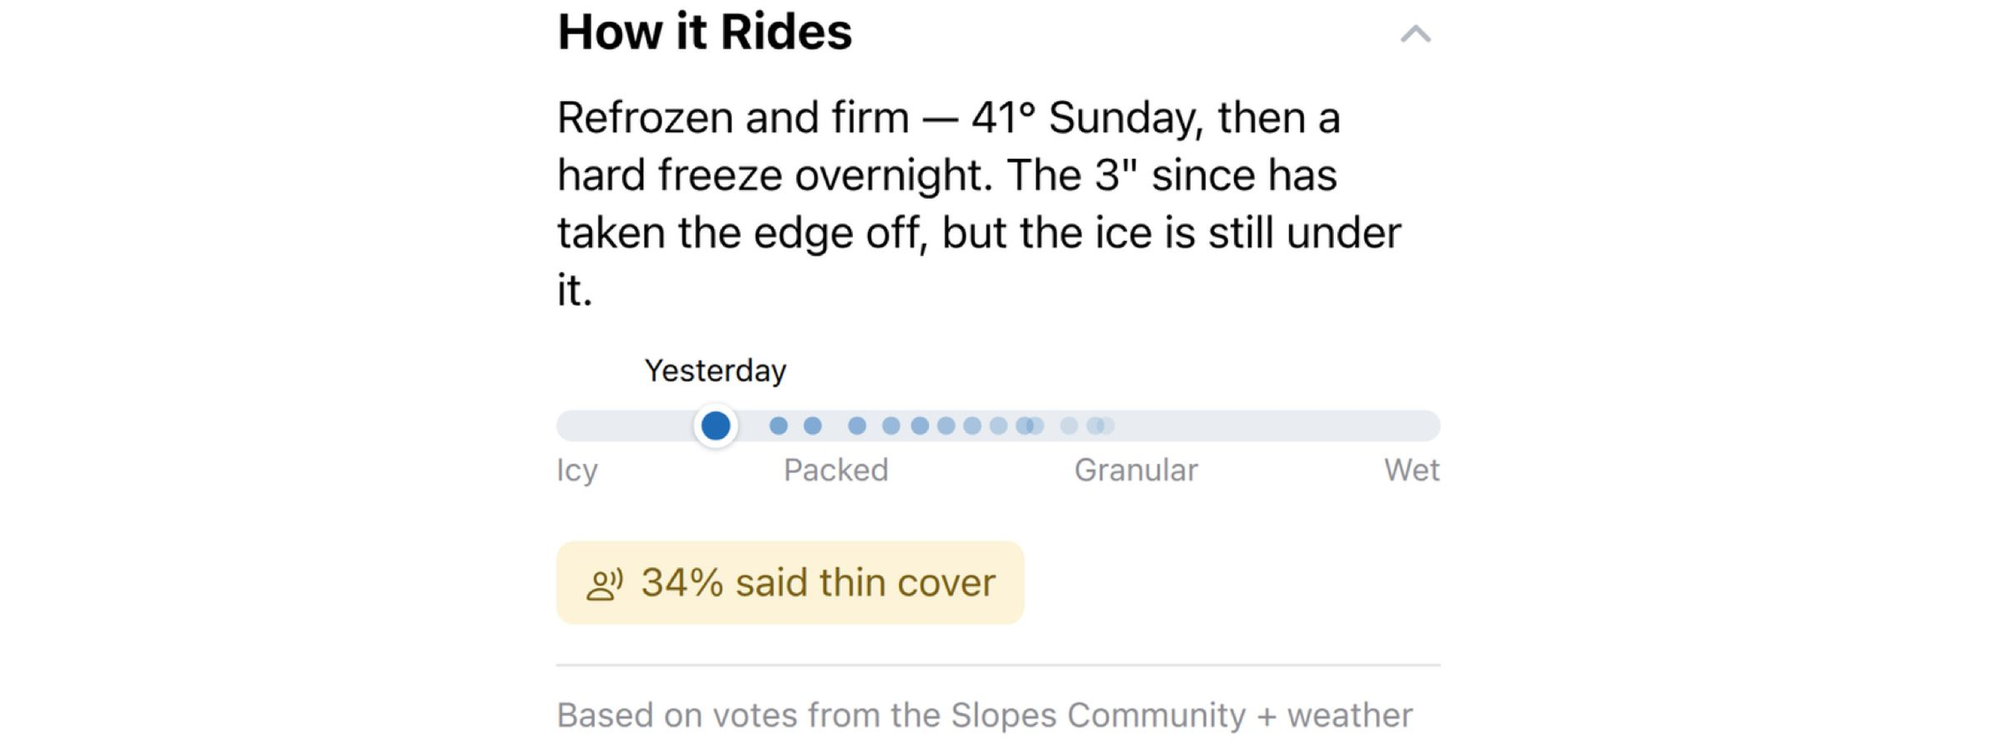
Slopes has a huge community of skiers and riders that provide daily condition reports by voting on a mix of signals like icy vs groomed vs wet vs granular. I'll be honest: the way we presented that data back then was rough. If you knew how to read the chart, you could derive some strong signals from it, but it certainly goes against the goal above of "how would you describe it to a friend."
So we rebuilt how we visualize what users are saying to show how it is changing over time on a single axis, and merged the more complex user reported data in with weather signals to help tell a more complete story:
Season Snowfall
Forecasts are great, but they don't tell a complete story of "how is this season going, though?" Sometimes we need that massive storm to get us back to where we should be and out of a dry spell.
For all resorts we'll show the previous 30 days of estimated snowfall so you can get a decent picture of the recent conditions.
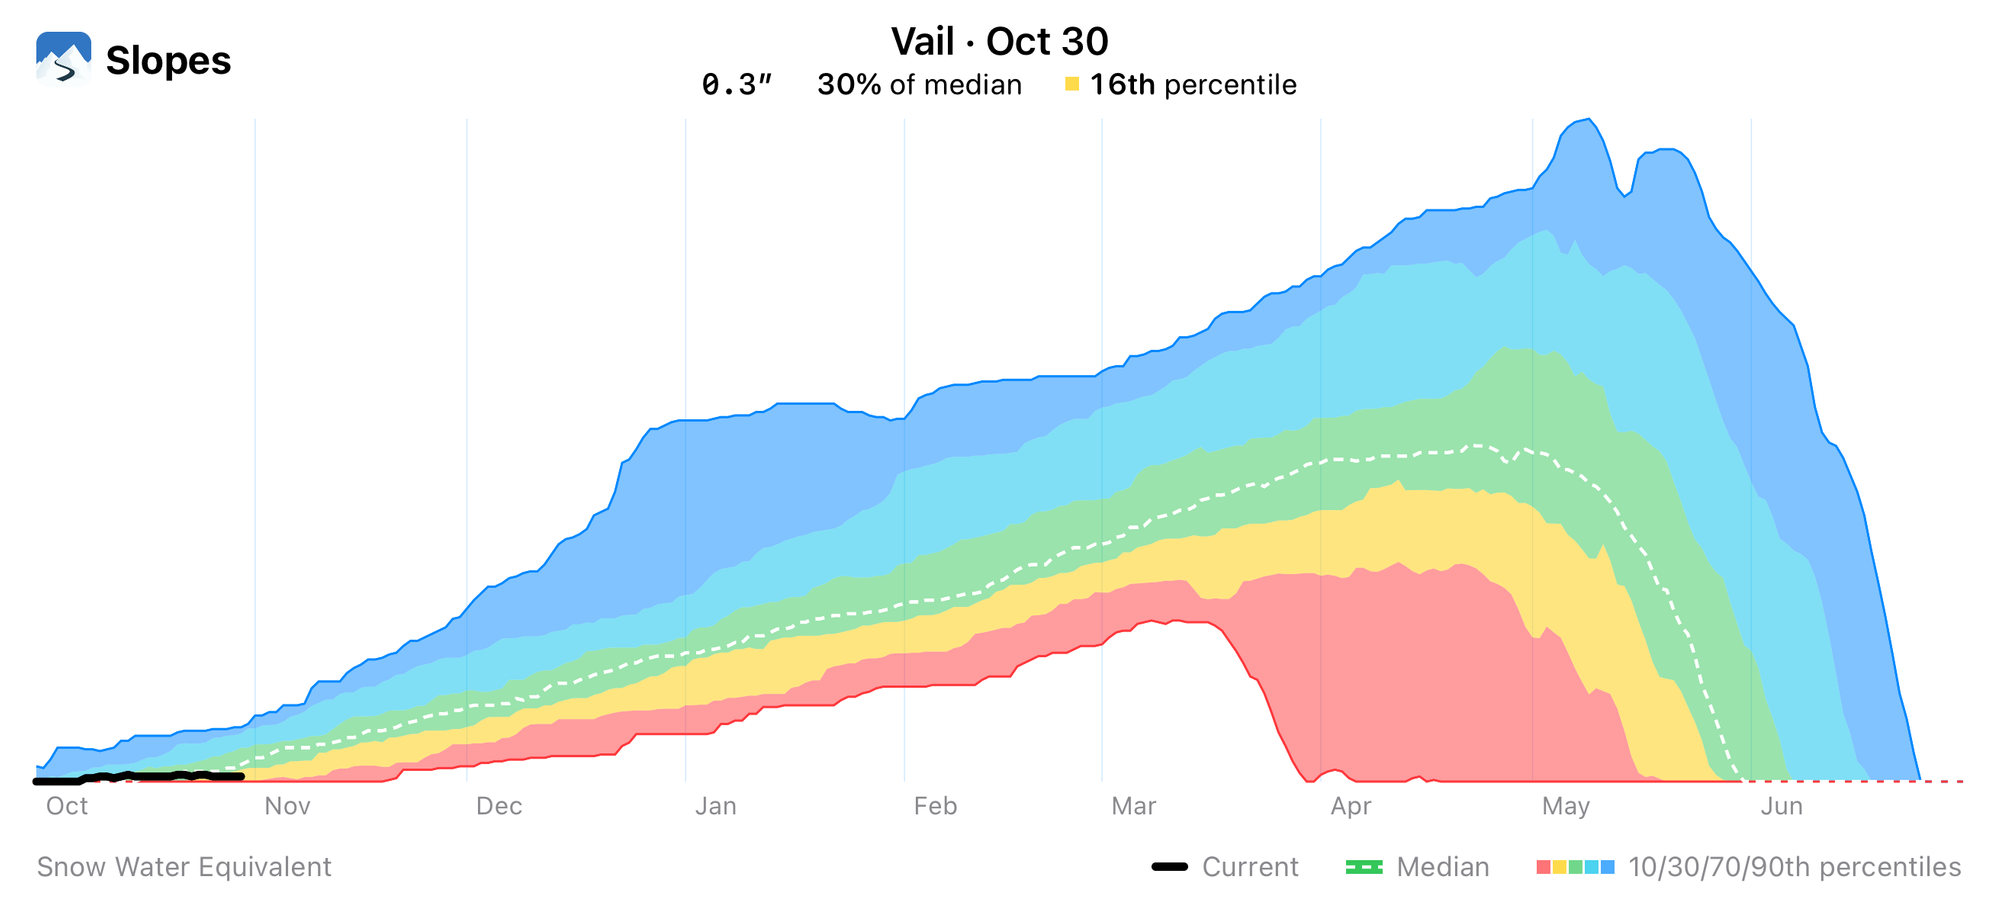
But even better though, we'll report SNOTEL (Snow Telemetry) station data where we can. Common in the western US, these stations give us an accurate way to measure what the snowfall has been like in the area. They report snow water equivalent (SWE), or how much water we'd get if we melted the snow. Reporting on depth alone wouldn't be accurate because snow can compact (even without melting), and even fresh snow can vary just based on how heavy vs airy it is.
Many of these stations have been around for 30+ years, so we have a rich history of data to compare against. Slopes will let you dig into that! A common comparison is "% of median", or "are we above or below where we should be historically speaking?" We also visualize the distribution of SWE thoughout the years to help you see just how much of an outlier the current yeear is.
We're really excited to get our take on forecasting in the hands of skiers and riders, and it's launching as a free update for all users on November 10th, for both iOS and Android!
